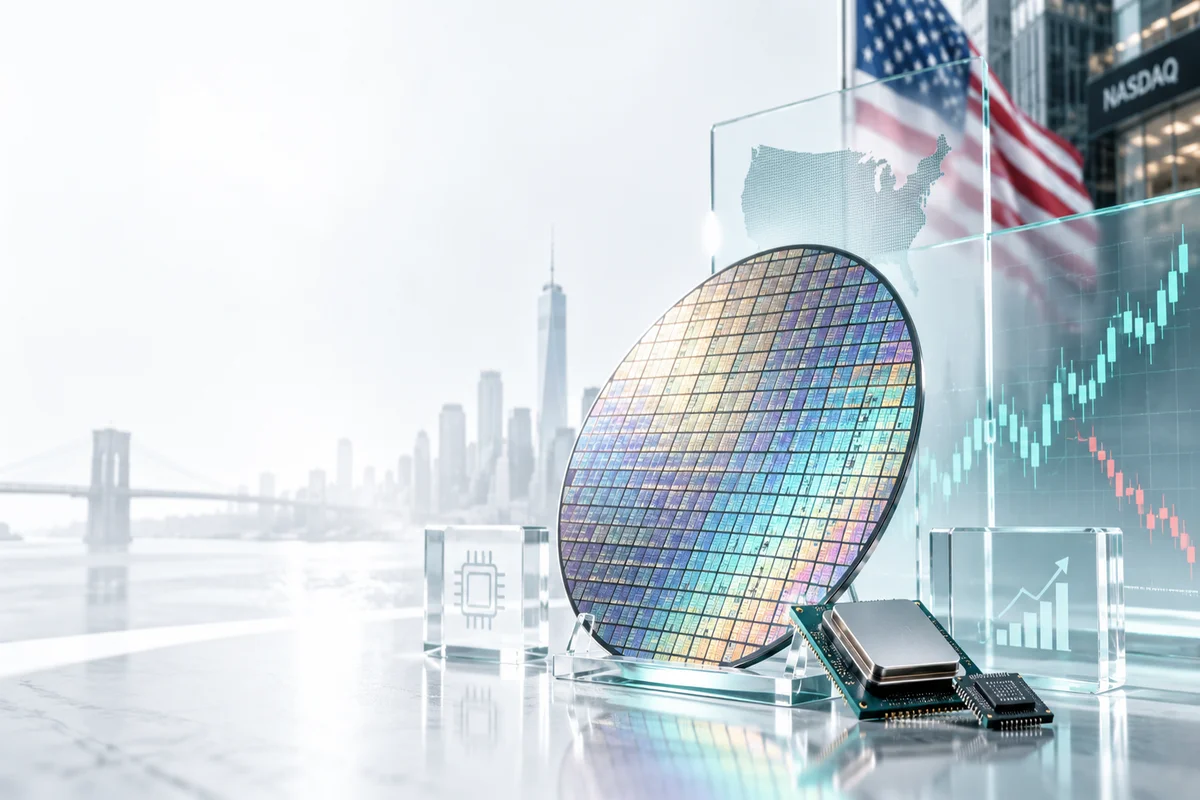
SOXX is the ticker for the iShares Semiconductor ETF, a product that bundles dozens of U.S. chip company stocks into a single instrument traded like a regular stock. With one purchase, you gain exposure to Nvidia, Broadcom, AMD, and fab equipment manufacturers without having to pick individual winners.
Interest in SOXX has strengthened throughout 2026 as AI infrastructure spending keeps demand for data center chips high. This article breaks down the composition, costs, performance, catalysts, and risks of SOXX from the perspective of an Indonesian investor. To understand the underlying sector, start with semiconductor stocks.
Key Takeaways
- Ticker and issuer: SOXX is an iShares ETF that tracks a U.S. semiconductor index containing approximately 30 issuers.
- Annual fees: The SOXX expense ratio is around 0.35 percent per year, which is higher than standard broad-market index ETFs.
- High concentration: The top ten holdings can account for about 60 percent of assets, meaning single-issuer risk is significant.
- Key catalysts: Hyperscaler AI capital expenditure and data center chip demand are the primary drivers of sector performance in 2026.
- Cyclical risks: The semiconductor sector is highly cyclical, so price corrections can be sharp when orders begin to slow.
What Is the SOXX ETF
SOXX is not a company name, but the trading code for the iShares Semiconductor ETF managed by BlackRock. This product tracks a U.S. semiconductor index and purchases member stocks according to their weight, so the price of SOXX moves in line with the chip sector average.
Because it is listed on U.S. exchanges, its units can be bought and sold throughout market hours just like regular stocks.
• Product form: An exchange-traded fund, not a mutual fund priced once a day.
• Benchmark index: Tracks a U.S. semiconductor index weighted by market capitalization.
• Number of issuers: Approximately 30 stocks, much narrower than the S&P 500 index which contains hundreds of issuers.
• Supply chain coverage: Includes chip design, foundries, memory, and fab equipment manufacturers.
• Comparison: For broader technology exposure, compare it with the QQQ ETF.
Because the number of issuers is small, SOXX is more like a directional bet on a single sector than a broad market portfolio. A reasonable position is usually as a complement, not a sole foundation, especially for investors who are new to US stocks.
How SOXX Works and Its Fee Structure
The mechanism of SOXX follows the pattern of a typical index ETF, where investor funds are used to purchase constituent stocks and fees are deducted directly from the asset value. The process can be simplified as follows.
1. Funds are collected: The investment manager pools capital from retail and institutional investors.
2. Stocks are purchased: The funds are used to buy index constituent stocks according to their target weights.
3. Weights are adjusted: Periodic rebalancing restores the composition to align with the index methodology.
4. Fees are deducted: The expense ratio is automatically withdrawn from the asset value each year.
5. Dividends are distributed: Dividends from constituent issuers are collected and then paid out to unit holders.
According to the iShares product page as of February 2026, the SOXX expense ratio is around 0.35 percent per year, about 15 basis points higher than low-cost broad index ETFs. This figure should be re-verified on the official website because ETF fees can change. For long-term investors, even a small difference like that impacts net returns after 10 years.
Portfolio Composition and Concentration
The composition of SOXX is dominated by large-cap companies that supply chips for data centers, mobile phones, and automotive applications. The weights are updated quarterly, so the exact figures may vary from month to month.
• Nvidia: Often the largest holding with a weight above 8 percent, highly sensitive to AI GPU demand.
• Broadcom: A large weight due to its networking and custom chip lines, serving as a key supplier to hyperscalers.
• AMD: A competitor in the CPU and accelerator market, whose performance depends on new product execution.
• Fab equipment: Players like Applied Materials and Lam Research account for a significant portion.
• Memory and analog: Issuers like Micron and Texas Instruments add a second layer of cyclicality.
First-quarter 2026 estimates show the top ten holdings account for approximately 60 percent of assets, meaning a single large issuer can significantly move the price of SOXX. This figure should be checked on the official fact sheet as rebalancing can change it.
Recent Performance and the 2026 AI Cycle
The performance of SOXX is inseparable from the AI capital expenditure cycle. According to World Semiconductor Trade Statistics forecasts released in early 2026, global chip sales are projected to grow by double digits throughout the year, the highest level in several recent cycles.
This figure is significant because sales growth is the primary engine for the earnings of issuers within SOXX. Since this is a forecast, verify the latest releases before making major decisions.
• Primary driver: Hyperscaler capital expenditure for GPUs and data center networking.
• Secondary driver: Recovery in demand for automotive and industrial chips following a stock correction phase.
• Headwind: Slowing consumer spending on mid-range electronic devices.
• Macro sensitivity: Benchmark interest rates and expectations for rate cuts determine the valuation of growth stocks.
Historical patterns show that the chip sector can rise rapidly when the cycle heats up and fall sharply when orders are revised. For new investors, entering gradually through a beginner stock investment guide is usually more realistic than buying all at once at a single price.
Catalysts to Monitor Throughout 2026
SOXX catalysts come from several layers simultaneously, ranging from macro factors to specific products. Here are the ones that most frequently move market prices.
• Macro: The Fed's interest rate trajectory, inflation, and labor data influence investor risk appetite.
• Sector: Quarterly hyperscaler capital expenditure releases signal long-term demand.
• Product: The launch of new-generation accelerators and new fab capacity changes the competitive landscape.
• Adoption: The growth of AI inference in enterprises increases chip demand volume beyond model training.
• Liquidity: Inflows or outflows from semiconductor ETFs influence short-term price pressure.
The timeline usually moves from macro releases to issuer earnings reports, followed by analyst estimate revisions. Adoption catalysts are usually the slowest to appear, but their impact is the most durable if they materialize.
Key Risks of Holding SOXX
SOXX is a sectoral product, so its risk is higher than that of broad-market ETFs. The following four risks are the most practical to keep in mind.
• Concentration risk: The weight of the largest issuers is very high, so bad news for one company can drag down the entire ETF; monitor the fact sheet each quarter.
• Cyclical risk: Chip orders can reverse quickly when customers build up inventory; check inventory trends in the earnings reports of major issuers.
• Valuation risk: The sector's price-to-earnings ratio can be well above the market average; compare it with earnings growth through fundamental analysis.
• Exchange rate risk: Indonesian investors bear the fluctuation of the rupiah against the US dollar on top of the stock price risk itself.
• Market hours risk: Unlike crypto assets that are active 24/7, SOXX is only liquid when US exchanges are open.
Simply put, a global tech correction could cause SOXX to drop much deeper than the broad market index in just a few weeks. The way to mitigate this risk is not to avoid it entirely, but to manage position sizing and maintain assets outside of the technology sector.
2026 Scenarios and Summary Table
The direction of SOXX this year depends on a combination of chip demand and macroeconomic conditions. The following table summarizes the three scenarios most frequently discussed by the market.
Reading this table is simple; a bearish scenario does not mean the sector is dead, only that prices are adjusting ahead of expectations. If you hold SOXX with a long-term strategy, the base scenario is usually the most uncomfortable because prices move sideways without a clear direction.
Checklist Before Buying SOXX
Before hitting the buy button, ensure the following points are clear. This checklist helps you avoid making decisions based on fleeting trends.
• Clear objective: Determine whether SOXX is being used as a technology complement or a full sector bet.
• Maximum allocation: Limit this type of sectoral position to about 5 to 10 percent of your portfolio.
• Source of funds: Use funds that are not needed for the next 12 months.
• Entry plan: Divide your purchases into several stages, for example, three or four installments.
• Evaluation threshold: Set a level to review your position, rather than just holding it without a plan.
• Data verification: Check the expense ratio, top holdings, and rebalancing dates on the official website.
This checklist is no guarantee of profit, but it forces you to think before the price moves against your position. Discipline at this stage is usually more decisive for the final outcome than perfect market timing.
Conclusion
SOXX is the most direct way to gain exposure to the US semiconductor sector in a single ticker, with an annual fee of around 0.35 percent and high concentration in a dozen major issuers. Its appeal stems from the 2026 AI cycle that continues to support chip demand, while its risks arise from its cyclical nature, valuations, concentration, and exchange rate exposure.
A reasonable position is usually small to medium, accompanied by assets outside of technology. Understand the composition and catalysts, then determine your position size before thinking about price targets.
FAQ
Start with Mobee
Mobee is a digital asset platform licensed and supervised by the OJK, allowing you to monitor market opportunities and investment products more effectively. Begin your investment journey through Mobee and choose products that align with your goals and risk profile.