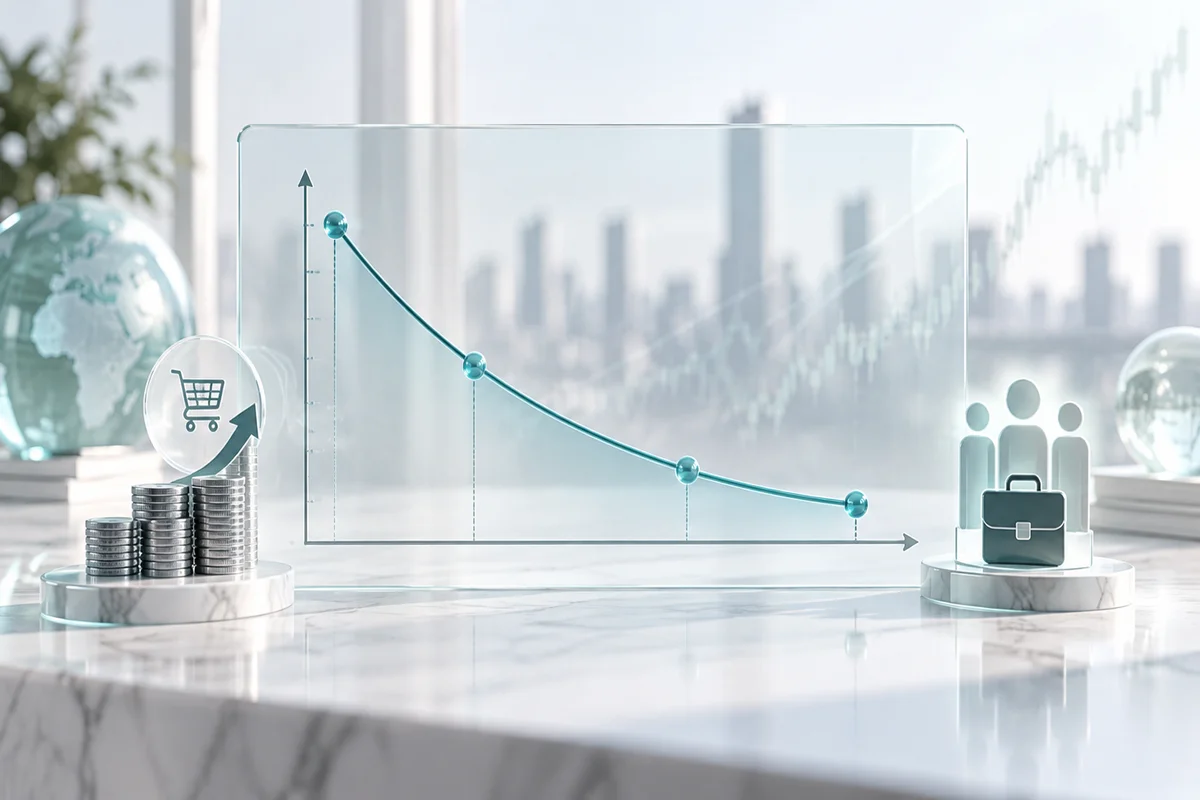
Complementary goods are products that are used together and tend to experience linked demand, such as smartphones with data plans or electric vehicles with charging stations. In 2026, this relationship helps explain why a price cut in one product can lift demand for its paired product.
You can see the pattern in daily markets, from coffee and sugar to game consoles and online subscriptions. Understanding complementary goods is useful for reading consumer behavior, pricing strategy, and business opportunities. For monetary context, review fiat money to strengthen your economic analysis.
Key Points
- Core definition: Complementary goods are consumed together, so demand for one product is linked to its pair.
- Cross price: A lower price for one product usually raises demand for its complementary product.
- 2026 examples: Smartphones and data plans, EVs and chargers, plus printers and ink remain relevant.
- Business strategy: Companies use bundling, device subsidies, or accessory discounts to lock in customers.
- Main risk: Complementary links can weaken due to new technology, income shifts, or government policy.
What complementary goods are and their traits
Complementary goods have a main trait: they create more value when consumed together. The relationship is not permanent because technology and habits can change it. Here are the traits you should recognize.
• Combined value: Complementary goods provide greater benefit when used together.
• Joint demand: Higher use of one product often raises use of its paired product.
• Negative cross elasticity: When price of good A rises, demand for good B tends to fall.
• Asymmetry: The link between two goods is not always equally strong in both directions.
• Context dependence: Technology, habits, and income determine how strong the link is.
These traits help you separate a real complementary relationship from a coincidental correlation. If two goods only look related because of a seasonal trend, your analysis can mislead you.
How price relationships work
Price relationships for complementary goods work through the total cost paid by consumers. When the price of one component falls, the total cost of using the pair also falls. That is why producers often use pricing on one side to drive the other side, similar to the logic in saving vs investing when calculating long-term benefits.
1. Watch the main good: If its price falls, consumers tend to buy more.
2. Track the paired good: Sales of accessories or support services usually rise.
3. Consider total cost: Consumers assess the combined price, not just one item.
4. Check producer response: A company may cut device prices to boost ink or subscription sales.
5. Reassess: If technology changes, the complementary link can weaken.
A simple example appears in printers and ink. Printers are often sold cheaply, but producers earn margin from ink. If printer prices rise sharply, ink sales also risk falling.
Examples in 2026
Complementary goods examples in 2026 span technology, automotive, and household sectors. This pattern also helps explain descriptive economic data, as discussed in descriptive economics, because consumer behavior appears in sales figures.
• Smartphones and data plans: IDC Q1 2026 reported global smartphone shipments of about 296 million units, down 1.2% year-on-year.
• EVs and charging stations: Gaikindo January-February 2026 reported Indonesia EV sales of about 8,500 units, up 35% year-on-year.
• Printers and ink: Businesses still sell cheap printers to lock in repeat ink sales.
• Coffee and sugar: Higher coffee prices can reduce sugar consumption at cafes if menu prices rise.
• Game consoles and subscriptions: Console owners buy games and online services as complementary goods.
These data points show that complementary goods are not just theory. Device sales give an early signal about demand for the services or accessories that come with them.
Complementary goods vs substitutes
The difference between complementary goods and substitutes lies in price direction and consumption patterns. Complementary goods are used together, while substitutes replace each other. Misreading this difference can make demand forecasts inaccurate.
• Price direction: Complements move in opposite directions, substitutes move in the same direction.
• Example: Cars and gasoline are complements, while cars and motorcycles can be substitutes.
• Consumer behavior: Complements add value, substitutes replace a choice.
• Pricing strategy: Bundling fits complements, while competitive discounts fit substitutes.
• Analysis risk: Wrong classification can make demand projections inaccurate.
In practice, the line between complements and substitutes can blur. Streaming and cable TV can be substitutes, but streaming and smart devices can be complements.
Factors that strengthen or weaken the link
The strength of a complementary link depends on purchasing power, technology, regulation, and infrastructure. When one factor changes, demand for the paired good can rise or fall quickly. Inflation also matters because it affects household spending, as explained in inflation impact.
• Purchasing power: BPS January 2026 reported inflation around 2.6% year-on-year, affecting spending on paired goods.
• Technology: Streaming can reduce demand for DVD players and related accessories.
• Regulation: EV incentives strengthen the link between electric cars and chargers.
• Infrastructure: IEA April 2026 counted about 6.5 million public charging points globally, supporting EV adoption.
• Preferences: Lifestyle and social trends can change how closely two goods are used together.
These factors mean complementary goods analysis must be updated. A strong link last year can weaken if technology or policy changes.
Impact on business and pricing strategy
Companies use the complementary goods concept to design pricing, bundling, and loyalty programs. This strategy often appears in markets with a few large players, similar to the dynamics discussed in oligopoly market. The goal is to raise total transaction value, not just sell one product.
• Bundling: Companies sell packages to increase transaction value.
• Device subsidies: Device prices are lowered to boost service sales.
• Lock-in: Customers are tied to an ecosystem, such as special ink or annual subscriptions.
• Demand forecasting: Sales teams use complementary data for inventory and promotions.
• Margin risk: Excessive discounts on one product can erode profit if the paired product does not sell enough.
Bank Indonesia in March 2026 reported a BI-Rate around 5.75%, which influences credit costs and demand for durable goods. When credit is more expensive, consumers may delay buying the main good and its complements.
Risks of misreading complementary goods
The main risk is assuming two goods always move together when the link is fragile. Sales data can mislead if it is not read alongside price, income, and technology. Here are the risks to watch.
• False correlation risk: Two goods look complementary when the link is only seasonal.
• Technology shift risk: New innovation can remove the need for a paired product.
• Price risk: A price increase in one good can unexpectedly reduce demand for the other.
• Regulation risk: New rules can change incentives and total consumer cost.
• Data risk: Delayed sales data can make inventory or promotion decisions miss the mark.
Reducing these risks requires validation from several sources. Compare retail data, industry reports, and consumer surveys before drawing
How to monitor 2026 opportunities at complementary goods
Monitoring complementary goods opportunities requires a simple framework you can repeat. Start with a pair of goods that are truly used together, then compare price and volume. For long-term decision context, review long-term investing.
1. Define the pair: Choose two products that are genuinely used together.
2. Collect price data: Track retail prices, discounts, and monthly subscription costs.
3. Check industry reports: Use BPS, Gaikindo, IDC, or IEA 2026 releases for validation.
4. Calculate simple cross elasticity: Compare price changes in one good with demand changes in its pair.
5. Build scenarios: Create bullish, neutral, and bearish demand scenarios.
6. Evaluate risk: Set a loss limit if the complementary link weakens.
The World Bank Global Economic Prospects January 2026 projected global economic growth of about 2.7% in 2026. This number matters because slower growth can reduce demand for discretionary complementary goods.
Summary table for complementary goods
Conclusion
Complementary goods are a simple concept with large implications for businesses, consumers, and investors. The key is to read price relationships, total cost, and technology shifts together. If one side of the link changes, the other side often rises or falls with it. Use 2026 data from BPS, Gaikindo, IDC, IEA, and the World Bank to update assumptions, then validate with other sources before making decisions.
FAQ
Start with Mobee
Mobee is a digital asset platform licensed and supervised by OJK, helping users explore crypto and investment products with clearer access and practical learning. Start your investment journey through Mobee and choose products that match your goals and risk profile.